The Astrophysical Journal·2026submitted
The Astrophysical JournalApJ·2026submitted·N. Starkman, J. Nibauer, et al.N. Starkman, J. Nibauer, S. Pearson, et al.N. Starkman, J. Nibauer, S. Pearson, S. Wu‡, L. Necib·The Astrophysical JournalApJ·2026submitted
The Astrophysical JournalApJ·2026submitted
How often stellar streams curve away from their host galaxy’s center can tell cold from self-interacting dark matter at up to 5σ, with catalogs the size Euclid, Rubin and Roman will provide.
How often stellar streams curve away from their host galaxy’s center can tell cold from self-interacting dark matter at up to 5σ, with catalogs the size Euclid, Rubin and Roman will provide. In a spherical halo a stream cannot curve this way in projection; in a triaxial halo, which cold dark matter predicts, it can. The test needs only the stream’s projected track and the host’s center: no distances, velocities or model of the stream’s progenitor.

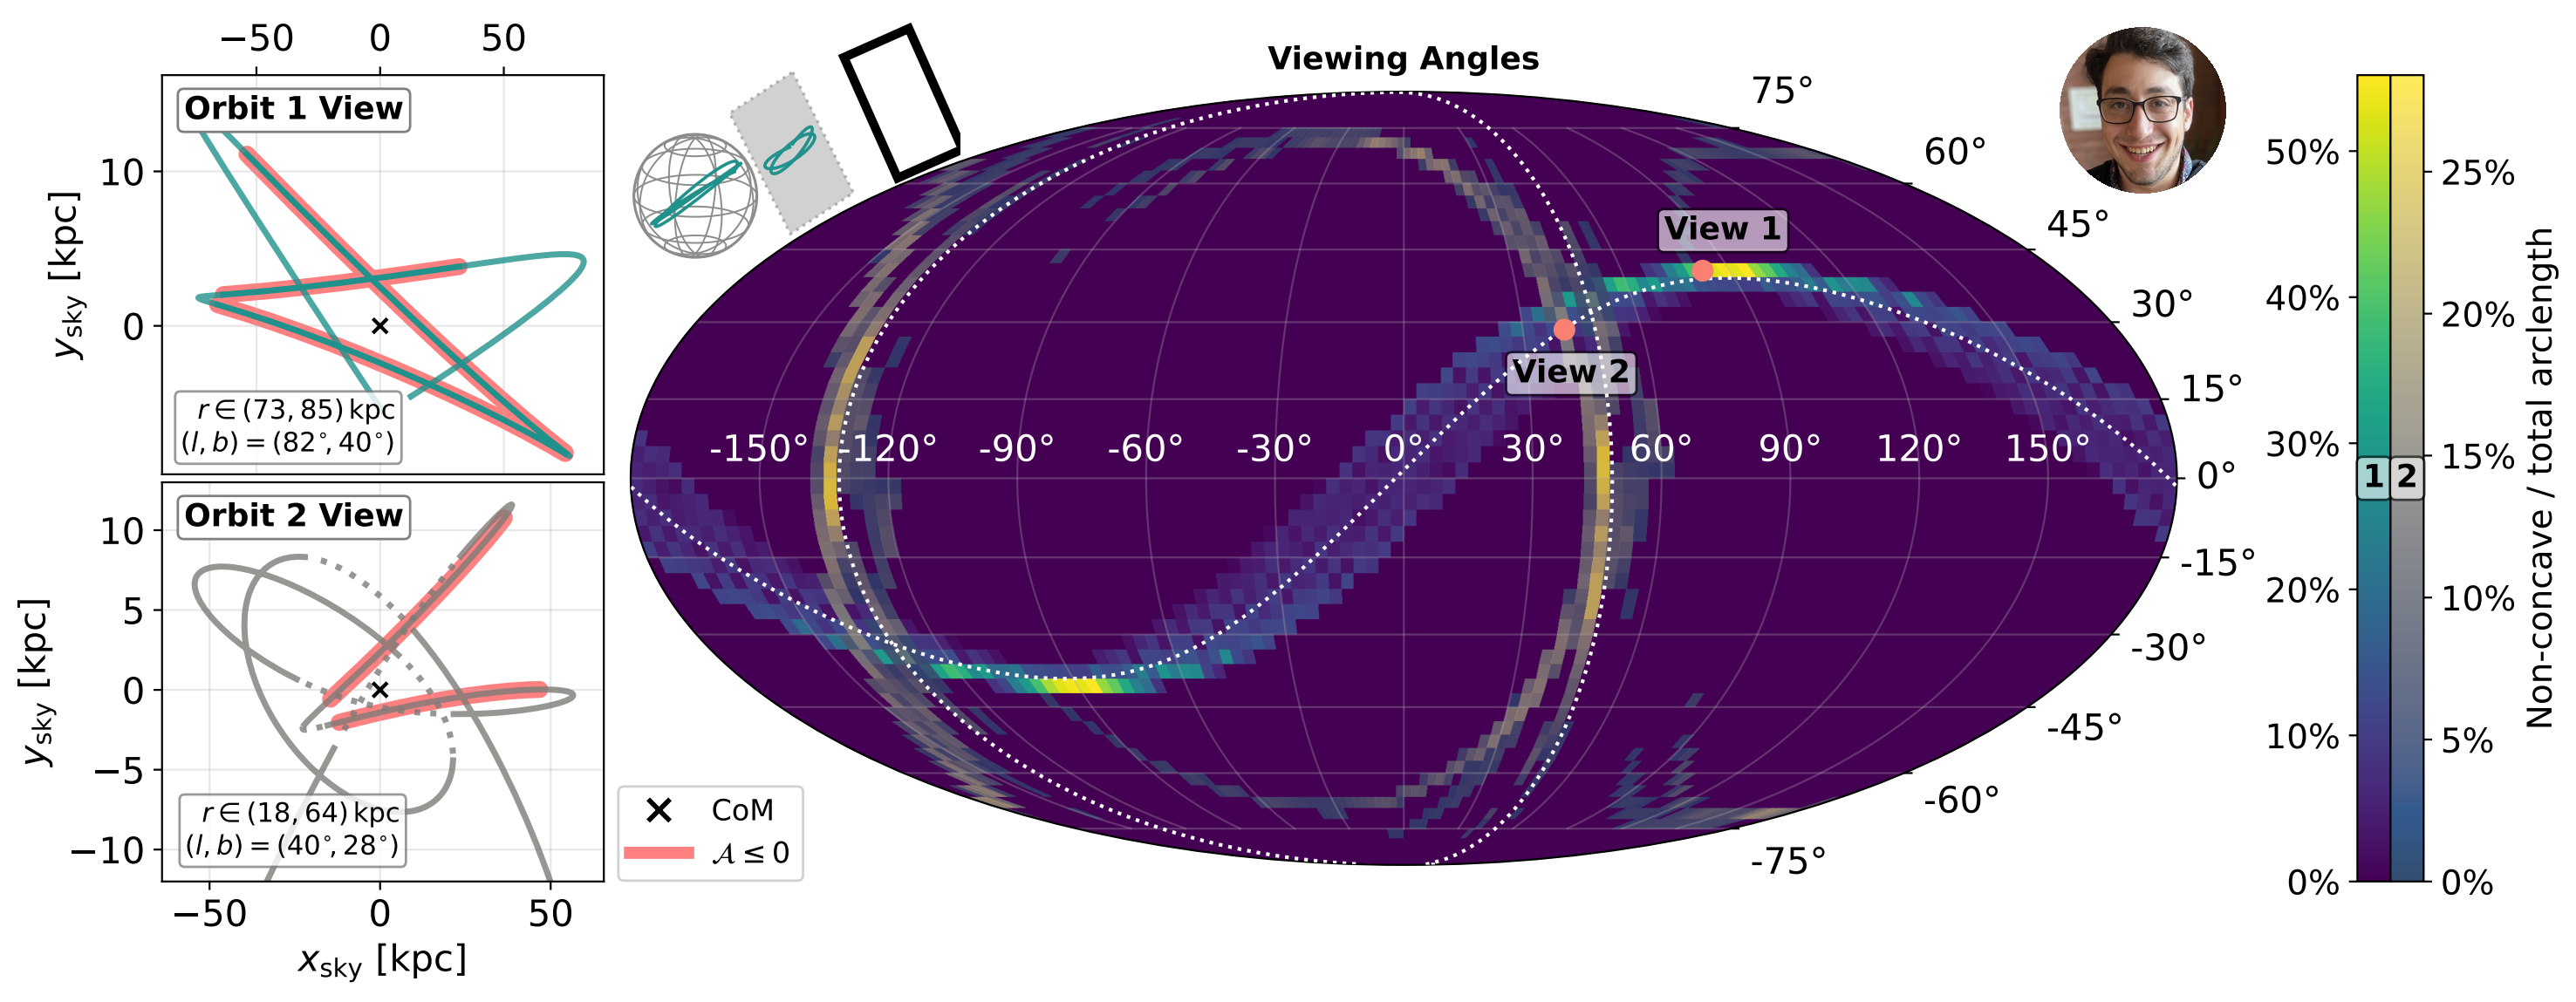
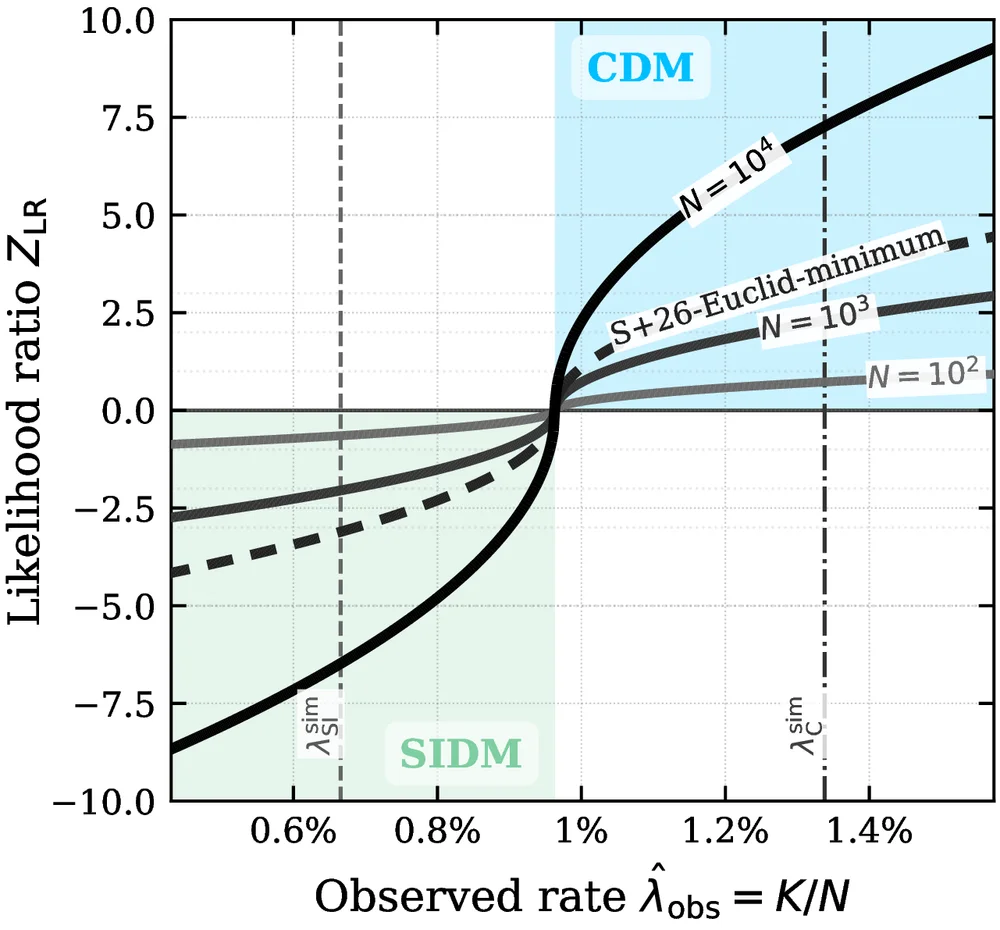
The nature of dark matter sets the shape of galactic halos: collisionless cold dark matter (CDM) predicts triaxial halos, while scattering in self-interacting dark matter (SIDM) rounds them toward sphericity. We show that a large catalog of projected stellar stream tracks can statistically constrain halo shapes, and therefore the particle nature of dark matter, without detailed modeling of any individual stream or gravitational potential. We develop a new geometric diagnostic for stellar streams: if the curvature of any segment along a stream points away from the host galaxy's projected center of mass, then that stream falsifies broad classes of potentials, including spherical ones. We call such a segment convex. The diagnostic needs only a projected stream track and a host-center estimate, requiring no kinematics, distances, progenitor model, or fit to individual host potentials. Halo triaxiality sets the rate at which streams show convex segments, making this rate an observable of the halo-shape distribution and the underlying dark-matter model. We forecast that upcoming survey-scale stream morphology catalogs can discriminate between CDM and SIDM at up to .
@misc{Starkman+:2026:stream-convexity-rate,
  author        = {Starkman, Nathaniel and Nibauer, Jacob and Pearson, Sarah and Wu, Sirui and Necib, Lina},
  title         = {{When Streams Curve Away: a Test of Dark Matter from Extragalactic Stellar Stream Populations}},
  journal       = {The Astrophysical Journal},
  year          = {2026},
  month         = {sep},
  eprint        = {2609.40057},
  archivePrefix = {arXiv},
  primaryClass  = {astro-ph.GA},
  adsurl        = {https://ui.adsabs.harvard.edu/abs/2026arXiv260940057S},
  abstract      = {The nature of dark matter sets the shape of galactic halos: collisionless cold dark matter (CDM) predicts triaxial halos, while scattering in self-interacting dark matter (SIDM) rounds them toward sphericity. We show that a large catalog of projected stellar stream tracks can statistically constrain halo shapes, and therefore the particle nature of dark matter, without detailed modeling of any individual stream or gravitational potential. We develop a new geometric diagnostic for stellar streams: if the curvature of any segment along a stream points away from the host galaxy's projected center of mass, then that stream falsifies broad classes of potentials, including spherical ones. We call such a segment convex. The diagnostic needs only a projected stream track and a host-center estimate, requiring no kinematics, distances, progenitor model, or fit to individual host potentials. Halo triaxiality sets the rate at which streams show convex segments, making this rate an observable of the halo-shape distribution and the underlying dark-matter model. We forecast that upcoming survey-scale stream morphology catalogs can discriminate between CDM and SIDM at up to $5\sigma$.},
  note          = {submitted}
}